BP releases Energy Outlook 2018
20 February 2018
BP has published the 2018 edition of its annual Energy Outlook, which analyzes the global energy transition out to 2040. Under its main, evolving transition (ET) scenario—which assumes that government policies, technologies and societal preferences evolve in a manner and speed similar to the recent past—the Energy Outlook expects:
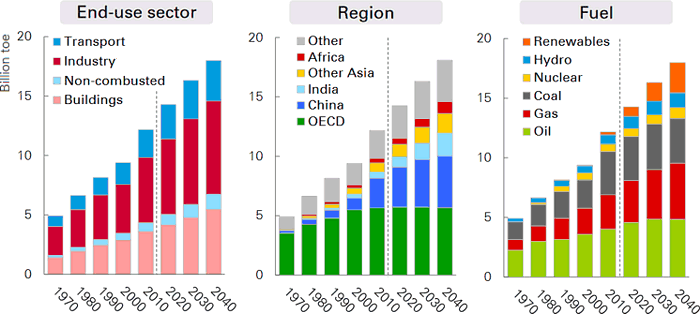
- Driven by fast growth in developing economies, global energy demand increases by about a third by 2040.
- In the global energy mix by 2040, oil, gas, coal and non-fossil fuels have about equal share of 25% each.
- Renewables are by far the fastest-growing fuel source, providing around 14% of primary energy.
- Demand for oil grows over much of Outlook period before plateauing in the later years.
- Natural gas demand grows strongly and overtakes coal as the second largest source of energy.
- Oil and gas together account for over half of the world’s energy.
- Global coal consumption flattens—it seems increasingly likely that Chinese coal consumption has plateaued.
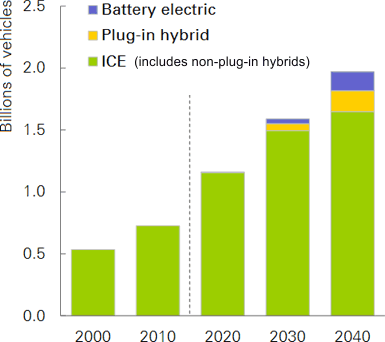
- The number of electric cars grows to around 15% of the car parc, but because of the much higher intensity with which they are used, account for 30% of passenger vehicle kilometers.
- Carbon emissions continue to rise.
The global energy demand is a result of the average global GDP growth rate of 3.25% per year (purchasing power parity exchange rates). This figure—broadly in line with growth seen over the past 25 years—is based on the assumed world population increase by around 1.7 billion to reach nearly 9.2 billion people in 2040. However, the Outlook expects that increasing productivity will be an even bigger driver of growth, accounting for three quarters of global expansion. Over 80% of the expansion in world output is driven by emerging economies, with China and India accounting for over half of that expansion. Africa continues to be weighed down by weak productivity, accounting for nearly half of the increase in global population but less than 10% of world GDP growth.
Global energy demand in the ET scenario grows at around 1.3% per year over the Outlook, down from over 2% in the previous 20 years. This slowing in demand growth is largely due to less energy used per unit of GDP—global GDP more than doubles over the Outlook, but energy consumption increases by only 35%.
Energy demand growth is broadly based across all the main sectors, with the industrial sector accounting for around half of the overall increase. Growth in transport demand is much slower than in the past, reflecting faster gains in vehicle efficiency.
In the ET scenario, carbon emissions from energy use grow through much of the Outlook, increasing by around 10% by 2040. This rate of growth is far slower than that seen in the past 25 years, when carbon emissions increased by 55%. Even so, the projected rate of growth is far higher than the sharp decline thought necessary to be consistent with achieving the Paris climate goals.
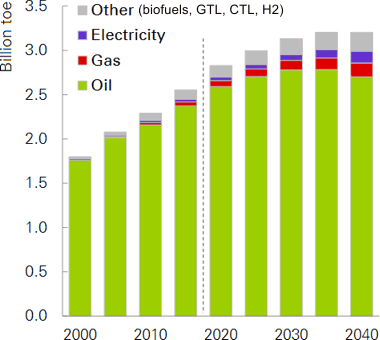
Transportation. In the ET scenario, global demand for both passenger and freight transport services more than double by 2040. These patterns are broadly consistent across road, aviation and marine. But the impact on transport fuel demand is largely offset by efficiency gains: energy used in transport increases by only 25% over the Outlook—far slower than the 80% increase during the previous 25 years—and plateaus towards the end of the Outlook.
The transport sector continues to be dominated by oil, despite increasing penetration of alternative fuels, particularly natural gas and electricity. Oil demand accounts for around 85% of total transport fuel demand in 2040, down from 94% currently. Natural gas, electricity and a mix of ‘other’ types of fuels are each projected to account for around 5% of transport fuel by 2040.
The number of passenger cars on the planet increases substantially by 2040, with an increasing number of electric cars and a substantial improvement in vehicle efficiency. The passenger car parc nearly doubles to 2 billion cars by 2040, including more than 300 million electric cars (plug-in hybrid and battery electric).
The Outlook expects that the efficiency of the global car parc will improve by 2-3% per year, significantly faster than in the past 15 years, driven by tightening regulations and government targets. In the EU, new cars in 2040 are likely to be around 70% more efficient than in 2000. A typical new ICE passenger car in the EU by 2040 consumes around 3 L/100 km, compared with 5 L today and 7 L in 2000.
By 2040 around 30% of passenger car vehicle kilometers are powered by electricity, significantly higher than the proportion of electric vehicles (EV) in the global car parc of just over 15%. This higher share reflects the importance of EVs in shared mobility, where the lower costs per km of EVs make them more competitive than ICE cars, as shared-mobility cars are used much more intensively.
Source: BP Energy Outlook 2018