BP Statistical Review shows slowing energy demand growth in 2019
22 June 2020
BP has released its 69th annual edition of the Statistical Review of World Energy, which collects energy data for 2019 and analyses the global energy trends prior to the Covid-19 crisis.
While the continuing strong growth in renewables “offer(s) encouragement that the world is moving onto a more sustainable path”—BP said in their press release—the report also shows that the global economy continues to be powered by fossil fuels. In 2019, oil, coal and natural gas supplied 84.3% of the global primary energy—a percentage that has been relatively stable for many years—resulting in continuing persistent growth in carbon emissions. The share of renewables (excluding hydro) in global primary energy consumption reached 5.0% in 2019.
Growth in primary energy consumption slowed to 1.3% in 2019, less than half of the 2.8% growth rate recorded in the previous year. This corresponds to the trends in global economic growth—the world’s GDP growth slowed down from 3% in 2018 to 2.3% in 2019, according to the UN World Economic Situation and Prospects (WESP) 2020.
The primary energy consumption growth rate of 1.3% was below its 10-year average rate of 1.6% per year. By region, consumption fell in North America, Europe and CIS and was below average in South & Central America. Demand growth in Africa, Middle East and Asia was roughly in line with historical averages.
China was by far the biggest individual driver of primary energy growth, accounting for more than three quarters of net global growth. India and Indonesia were the next largest contributors, while the United States and Germany posted the largest declines in energy terms.
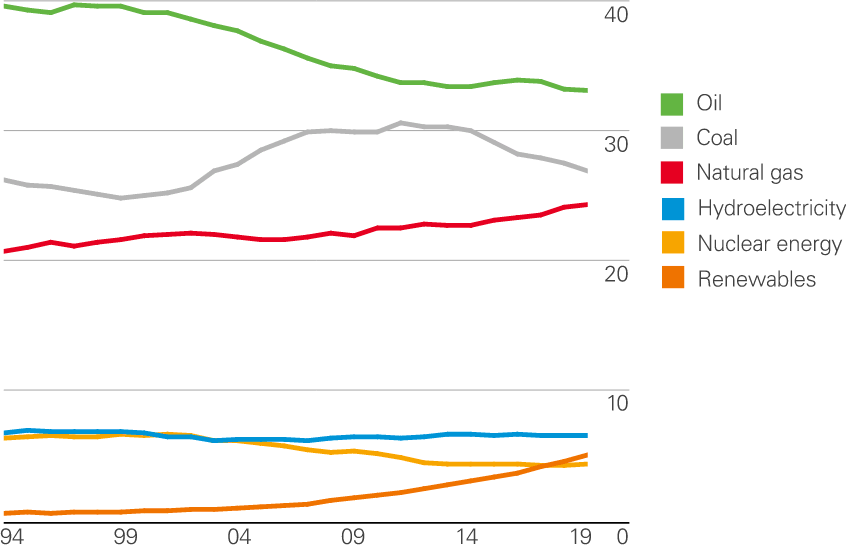
Oil continues to hold the largest share of the energy mix (33.1%), Figure 1. Coal is the second largest fuel but lost share in 2019 to account for 27.0%, its lowest level since 2003. The share of both natural gas and renewables rose to record highs of 24.2% and 5.0% respectively. Renewables has now overtaken nuclear which makes up only 4.3% of the energy mix. The share of hydroelectricity has been stable at around 6% for several years.
Average global energy consumption per capita increased by only 0.2% in 2019 to 75.7 GJ/head, driven by growth in the Middle East (1.4%) and Asia Pacific (2.4%). Energy demand per head fell in all other regions. North America is the region with the highest consumption per capita (236 GJ/head), followed by CIS (158 GJ/head) and the Middle East (151 GJ/head). Africa remains the region with the lowest average consumption (15 GJ/head).
Other key findings from the BP Statistical Review 2020 include:
- Carbon emissions from energy use grew by 0.5% in 2019, only partially unwinding the unusually strong growth of 2.1% seen in 2018. Average annual growth in carbon emissions over 2018 and 2019 was greater than its 10-year average.
- Renewables contributed their largest increase in energy terms on record (3.2 exajoules). They accounted for over 40% of the global growth in primary energy last year, more than any other fuel. Their share in power generation (10.4%) also surpassed nuclear for the first time.
- Natural gas consumption increased by 2%, well below the more than 5% growth seen in 2018, but its share of primary energy still hit a record high of 24.2%. Natural gas production rose by 3.4%, buoyed by a record increase in liquefied natural gas exports (54 billion m3).
- Oil consumption grew by a below-average 0.9 million barrels per day, or 0.9%, while demand for all liquid fuels, including biofuels, topped 100 million b/d for the first time.
- Coal’s share of primary energy fell to its lowest level in 16 years (27%), after consumption fell by 0.6%, led by a sharp drop in OECD demand. However, coal remained the single largest source of energy for power generation, accounting for over 36% of global power.
- Electricity generation grew by only 1.3%—around half its 10-year average. China accounted for more than 90% of net global growth.
Source: BP