Global GHG emissions reached new high in 2019
10 December 2020
Global greenhouse gas emissions reached a new record high in 2019, according to the Emissions Gap Report 2020, the 11th edition of the annual GHG emission analysis by the UN Environment Programme (UNEP) [4986]. In addition to the 2019 data, this year’s report also includes some analysis of the projected 2020 emissions.
In 2019, total GHG emissions, reached a new high of 59.1 Gt of CO2 equivalent (GtCO2e) when including land-use change (LUC), and 52.4 GtCO2e without LUC, Figure 1. Fossil CO2 emissions (from fossil fuels and carbonates) dominate total GHG emissions including LUC (65%) and consequently the growth in GHG emissions.
Since 2010, GHG emissions without LUC have grown at 1.3% per year on average, with preliminary data suggesting a 1.1% increase in 2019. When including the more uncertain and variable LUC emissions, global GHG emissions have grown 1.4% per year since 2010 on average, with a more rapid increase of 2.6% in 2019 due to a large increase in forest fires.
The distribution of GHG emissions across sectors—an important consideration for policymaking—is shown in Figure 2 [4985]. Energy transformation dominates GHG emissions, with electricity and heat generation accounting for 24% of total GHG emissions in the last decade and other energy transformation and fugitive emissions adding another 10%. The transport sector has contributed to around 14% of global GHG emissions on average over the last decade, with road transport—a sector that continues to have strong growth—primarily responsible. Shipping and aviation are relatively smaller than road transport, with emissions in international territory comprising 2.2% of total GHG emissions, noted the report.
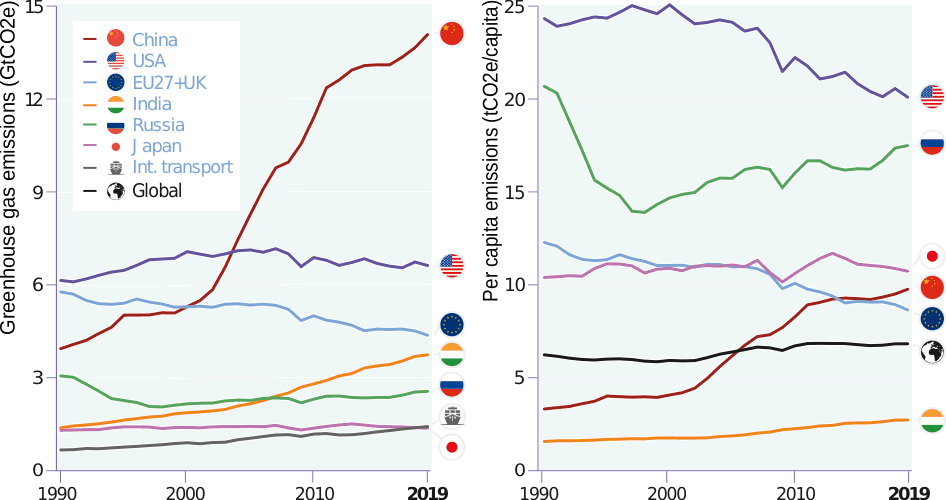
Over the last decade, the top four emitters—China, the United States, EU27+UK and India—have contributed to 55% of the total GHG emissions without LUC, Figure 3. The top seven emitters (including Russia, Japan and international transport) have contributed to 65%, with G20 members accounting for 78%. The ranking of the top emitting countries changes dramatically when considering per capita emissions, with the USA still in the lead, followed by Russia, Japan, China, and the EU27+UK.
The global economic slowdown related to the Covid-19 pandemic is expected to cause CO2 emissions to fall up to 7% in 2020, relative to 2019. However, long-term, this dip means only a 0.01°C reduction of global warming by 2050, according to the UNEP report. Whether global GHG emissions peaked in 2019 or will continue to increase in the future, remains unknown.
Government pledges under the Paris Agreement (nationally determined contributions, NDC) are still “woefully inadequate”, states the report. Predicted emissions in 2030 leave the world on the path to a 3.2°C increase this century, even if all unconditional NDCs are fully implemented. The levels of ambition in the Paris Agreement would have to be tripled for the 2°C pathway (GHG emission reduction of 23% from 2019 levels by 2030), and increased at least fivefold for the 1.5°C pathway (emission reduction of 56%).
The report noted that the growing number of countries that are committing to net-zero emission goals by around mid-century is “the most significant and encouraging climate policy development of 2020”, however, it is “imperative” that those commitments actually be translated into policy.
Source: UN Environment Programme