BP Statistical Review shows a sharp rebound in energy demand in 2021
8 July 2022
BP released the Statistical Review of World Energy 2022 last week—the 71st edition of their annual report that collects energy data through 2021. The data show a sharp rebounce in global primary energy in 2021, increasing by 5.8% and more than reversing the sharp fall in energy consumption in 2020 as much of the world locked down. Primary energy use in 2021 was 1.3% above its 2019 level.
Primary energy grew by 31 EJ in 2021, the largest increase in history. Primary energy in 2021 was 8 EJ above 2019 levels. The increase in primary energy in 2021 was driven by emerging economies, which increased by 13 EJ, with China expanding by 10 EJ. Fossil fuels accounted for 82% of primary energy use last year, down from 83% in 2019 and 85% five years ago.
Taking 2020 and 2021 together, primary energy consumption in emerging economies increased by 15 EJ, largely reflecting growth in China (13 EJ). In contrast, energy demand in developed economies in 2021 was 7 EJ below 2019 levels. The increase in primary energy between 2019 and 2021 was entirely driven by renewable energy sources. The level of fossil fuel energy consumption was unchanged between 2019 and 2021, with lower oil demand (-8 EJ) offset by higher natural gas (5 EJ) and coal (3 EJ) consumption.
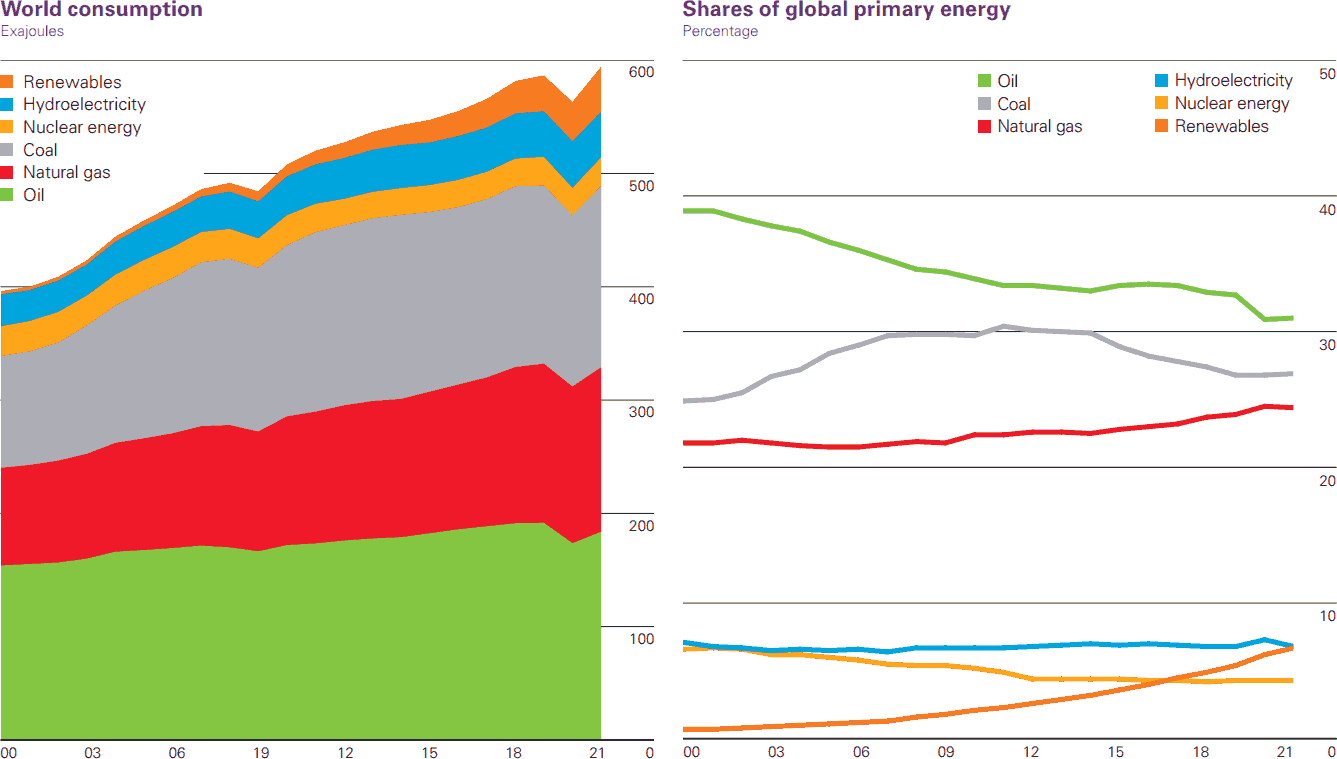
Renewables include solar, wind, geothermal, biomass, and other
(Source: BP Statistical Review of World Energy 2022)
Carbon dioxide emissions from energy use, industrial processes, flaring and methane (in CO2 equivalent) rose 5.7% in 2021 to 39.0 GtCO2e, with CO2 emissions from energy rising 5.9% to 33.9 GtCO2, close to 2019 levels.
Oil consumption increased by 5.3 million barrels per day (b/d) in 2021 but remained 3.7 million b/d below 2019 levels. Much of this weakness was concentrated in aviation-related oil demand, which was more than 2.5 million b/d (33%) below 2019 levels.
A majority of the oil consumption growth came from gasoline (1.8 million b/d) and diesel/gasoil (1.3 million b/d). Regionally, most of the growth took place in the United States (1.5 million b/d), China (1.3 million b/d) and the EU (570,000 b/d).
Global oil production increased by 1.4 million b/d in 2021, with OPEC+ accounting for more than three-quarters of the increase. Among all countries, Libya (840,000 b/d), Iran (540,000 b/d) and Canada (300,000 b/d) saw the largest increases. Nigeria (-200,000 b/d), the UK (-170,000 b/d) and Angola (-150,000 b/d) reported the biggest declines.
Refinery capacity declined for the first time in over 30 years by almost 500,000 b/d last year, driven by a sharp reduction in the OECD (1.1 million b/d). As a result, refining capacity in the OECD in 2021 was at its lowest level since 1998.
Natural gas demand grew 5.3% in 2021, recovering above pre-pandemic 2019 levels and crossing the 4 Tcm mark for the first time. Its share in primary energy in 2021 was unchanged from the previous year at 24%.
LNG supply grew 5.6% (+26 Bcm) to 516 Bcm in 2021, its slowest rate of growth since 2015 (other than in 2020). LNG supply from the US rose by 34 Bcm, accounting for most of the new incremental supplies. China surpassed Japan as the world’s largest LNG importer and accounted for close to 60% of global LNG demand growth in 2021.
Coal consumption grew over 6% in 2021 to 160 EJ, slightly above 2019 levels and its highest level since 2014. China and India accounted for over 70% of the growth in coal demand in 2021, increasing by 3.7 and 2.7 EJ, respectively.
Global coal production matched consumption with an increase in supply of 440 Mt. China and India accounted for much of the increase in production, which was largely consumed domestically, as well as Indonesia, supporting higher exports. Notably, both Europe and North America showed an increase in coal consumption in 2021 after nearly 10 years of back-to- back declines.
Electricity generation increased by 6.2% in 2021—similar to the strong bounce back seen in 2010 in the aftermath of the financial crisis (6.4%). Coal remained the dominant fuel for power generation in 2021, with its share increasing to 36%, up from 35.1% in 2020. The use of natural gas for power generation increased by 2.6% in 2021, although its share decreased from 23.7% in 2020 to 22.9% in 2021. Wind and solar reached a 10.2% share of power generation in 2021, the first time wind and solar power have provided more than 10% of global power and surpassing the contribution of nuclear energy.
However, in absolute numbers, new wind and solar generation continues to lag behind the growth in total electricity generation—with the exception of 2020, when the global economy and electricity generation contracted—Figure 2. This means that wind and solar energy has not yet replaced any fossil fuels, and is merely being added on top of the growing fossil fuel based generation.
(Data: BP Statistical Review of World Energy 2022)
The global economy consumed 595 EJ of primary energy in 2021. Expressed in terms of primary energy consumption—according to BP data and methodology—wind energy contributed 17.54 EJ or 2.95% of this total, while solar energy amounted to 9.73 EJ or 1.63%. Combined, wind and solar provided 4.58% of global primary energy consumption in 2021.
The BP Statistical Review report also includes price information on energy commodities, as well as data on key mineral resources consumed by electric vehicles, including cobalt, lithium, graphite, and rare earths.
Source: BP Statistical Review of World Energy